
Network and bandwidth comparison: Nagios, Icinga, Cacti and Ntop
In a constantly interconnected world, where information technology supports most business resources, it is a necessity to have very fast response times, to customers, partner companies, and agents on the ground.
To be able to compete, it is necessary to have an efficient, reliable network and to be able to monitor disruptions so as to intervene before they happen
In times of outages, it is important to get accurate and fast disruption (downtime) information and to be able to intervene with real-time assistance on issues
The Network management and bandwidth monitor are increasingly important to get up-to-date information in real time, plan necessary support, have reliable reports, understand bandwidth needs and where are bottlenecks to be eliminated and what protocols, programs, what network traffic to prioritize
Bandwidth monitor and Network manager closed vs opensource
There are various closed source solutions, among which HP certainly takes the lion's share with its products: "HP Openview" and "HP Network Node Manager"
These products have costs of several thousand euros and like all closed source software should be taken as is, without any possibility of modification and modularity to beyond that offered by the manufacturer
In addition to the described problems one must keep in mind the cost of product updates
Why spend to buy a closed software, without possibility of updates, modifications when there are free and opensource solutions with greater functionality and modularity?
Many of the projects we will see are based on Linux and are available for free (opensource or free software licenses)
Nagios
Talking about opensource NMS (Network management station) is definitely the first we hear about, a solid, well-maintained project and de facto standard in the industry, from which many forks and additions to the monitoring system have sprung, personally, I have been using it for years without having any major problems other than due to bad configurations and hardware fail
Features of Nagios:
- Continuous reachability monitoring, services status
- Hierarchical dependency management via parent and child hosts (if the parent falls out, the underlying network part is not reached)
- Hierarchical host map and indicative of status (up/down)
- SNMP testing for router and switch management
- Alarm management based on groups, times and days
- Templates for similar hosts
- Host and service reachability statistics
- Many plugins to extend functionality, available at https://exchange.nagios.org/
- Possibility to schedule downtime and add descriptions to events
Icinga
Born as a fork of Nagios it focuses more on modularity, has a revamped GUI, supports most of the plugins available for nagios
Icinga version 2 is based on the rewrite of the Nagios framework and rewrite
A small note, among the users of Icinga stands out Debian (well-known Linux distribution), which is very demanding in terms of both software licensing and packaging and stability
Features:
- Very similar to Nagios, plugins are compatible
- Faster development
- Excellent packaging
- Configuration via web director
- Distributed and scalable, encrypted communications
Cacti
It focuses on visualizing traffic generated on switch and router ports and data available through SNMP (CPU or RAM load, temperatures...) but does not discriminate stream type except by upload, downloads and speed
- SNMP poller very fast and parallelizable across multiple cores or CPUs
- Add host from web interface
- Management hierarchical graphs
- Multiple user management and viewing permissions
- Templates for similar hosts
Ntop
Ntop is a very interesting bandwidth management solution, especially the Ntopng version, because of its integration with NDPI, the DPI Deep Packet Inspection module, which allows us to get detailed reports on which protocols are using the most bandwidth (allows us to ferret out who is using emule, bittorrent in the enterprise) by analyzing the Layer 7 header, of packets transiting the network
Features:
- DPI deep packet inspection (traffic analysis based on packet header and not on ports)
- Wide filtering views
- Top talkers (major network users) and graphical analysis of the type of traffic generated
- Geolocation of hosts and services
- Netflow and sFlow collector
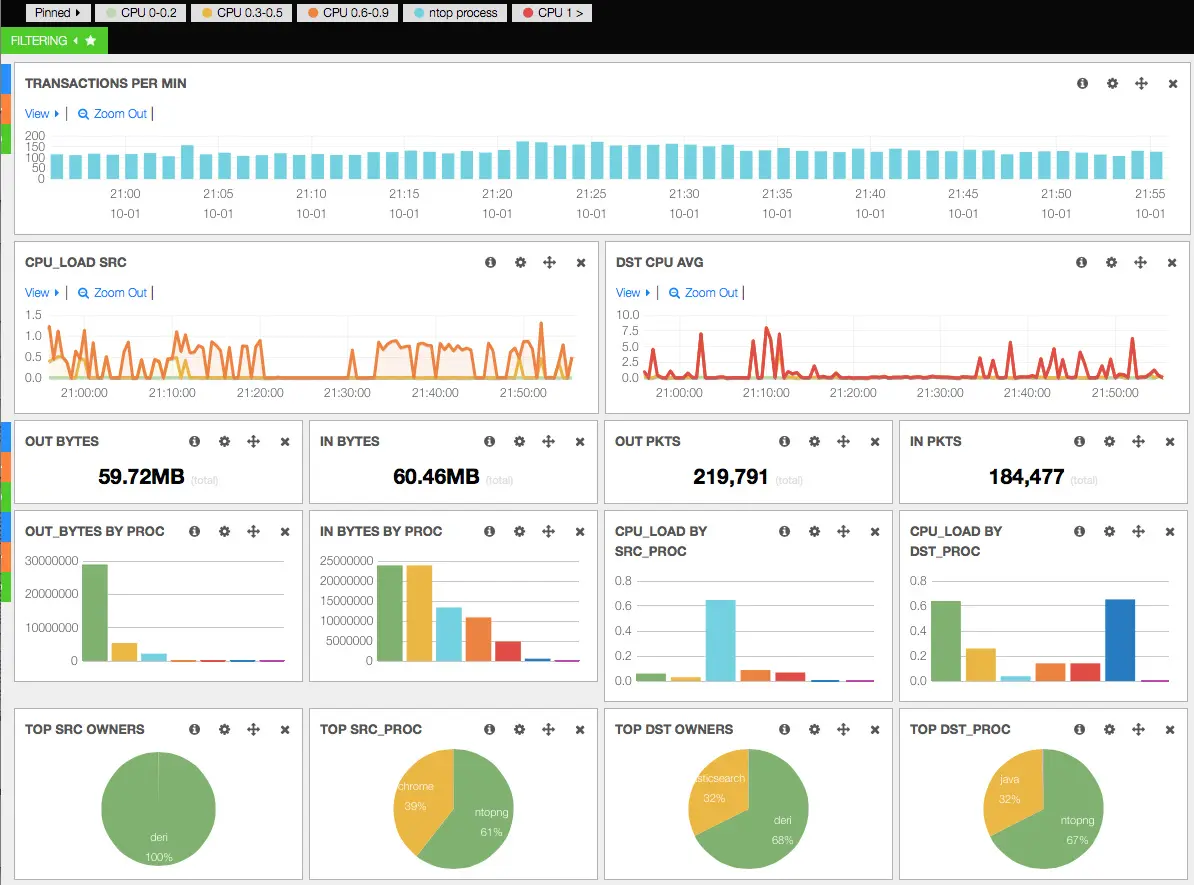
- Comfortable traffic visualization dashboard with automatic update
Our solution
These software are definitely the best open source tools for traffic monitoring and services, data analysis and multichannel notification
During the evaluation, the greatest versatility, ability to scale thanks to the Icinga2 API, as well as the mobile friendly web configuration interface
Another big selling point is the compatibility with nagios plugins, now over 130.000 open source monitoring scripts
Icinga2 has a design born for high reliability, integrates with Influxdb and Grafana to create historical charts making it easy to compare trends
Request your free 30-minute consultation: Integrated Monitoring Icinga2, Grafana and Slack