

Configuration Icinga2, Influxdb and Grafana
Collecting Icinga2 metrics on InfluxDB and creating historical graphs, for network monitoring is critical.
Maintaining check results on Time Series Database (TSDB), allows comparison of load, disk IO, database, and everything else needed to understand what an alert notification was generated from, to prevent disservice or degradation
Therefore, it is necessary to:
- Create the necessary databases
- Create user credentials and passwords
- Configure the Retention Policy (RP)
- Configure monitoring to send metrics to Influx
- Configure a Grafana data source to read the metrics
Create Influxdb databases for Icinga2 and Collectd
It is necessary to create some databases, in which we are going to write our measurements or performance data
CREATE DATABASE icinga2dbCREATE DATABASE collectdGrafana user creation
If authentication has been enabled you will need to log in as administrator using the password
docker exec -en bash influx -username 'adminname' -password passwordsupersecure# User creation
CREATE USER 'grafanadb' WITH PASSWORD 'grafanadbpass';
GRANT READ ON grafana TO icinga2db;
GRANT READ ON grafana TO collectd;Icinga user creation
CREATE USER 'icinga2user' WITH PASSWORD 'icinga2pass';GRANT ALL ON icinga2db TO icinga2user;Let's test the operation of the created users
curl -G http://localhost:8086/query -u grafanadb:grafanadbpass --data-urlencode "q=SHOW DATABASES"curl -G http://localhost:8086/query -u icinga2user:icinga2pass --data-urlencode "q=SHOW DATABASES"Retention Policy Configuration.
It is recommended to create a policy to delete old data, so as not to run out of disk space
The default autogen policy keeps all data indefinitely
Creating a Retention Policy
We also want to set it as the default on the DB
CREATE RETENTION POLICY "six_months" ON "collectd" DURATION 180d REPLICATION 1 DEFAULTCREATE RETENTION POLICY "six_months" ON "icinga2db" DURATION 180d REPLICATION 1 DEFAULTDeleting a Retention Policy
If we don't need it, we can delete the data in the Retention Policy (RP) autogen
USE
DROP RETENTION POLICY autogen
Icinga2 Configuration.
At this point we need to enable and configure thesending of performance to Influx
icinga2 feature enable influxdbIt remains to configure the metrics tag, and the connection parameters to our influx server
For the complete configuration you can refer to the official guide
Configuring the Grafana Data Source.
Grafana allows you to read metrics from different sources, such as Graphite, Elasticsearch, InfluxDB, and many others
It will be sufficient to set the address and name of our DB, port, username and password defined during configuration
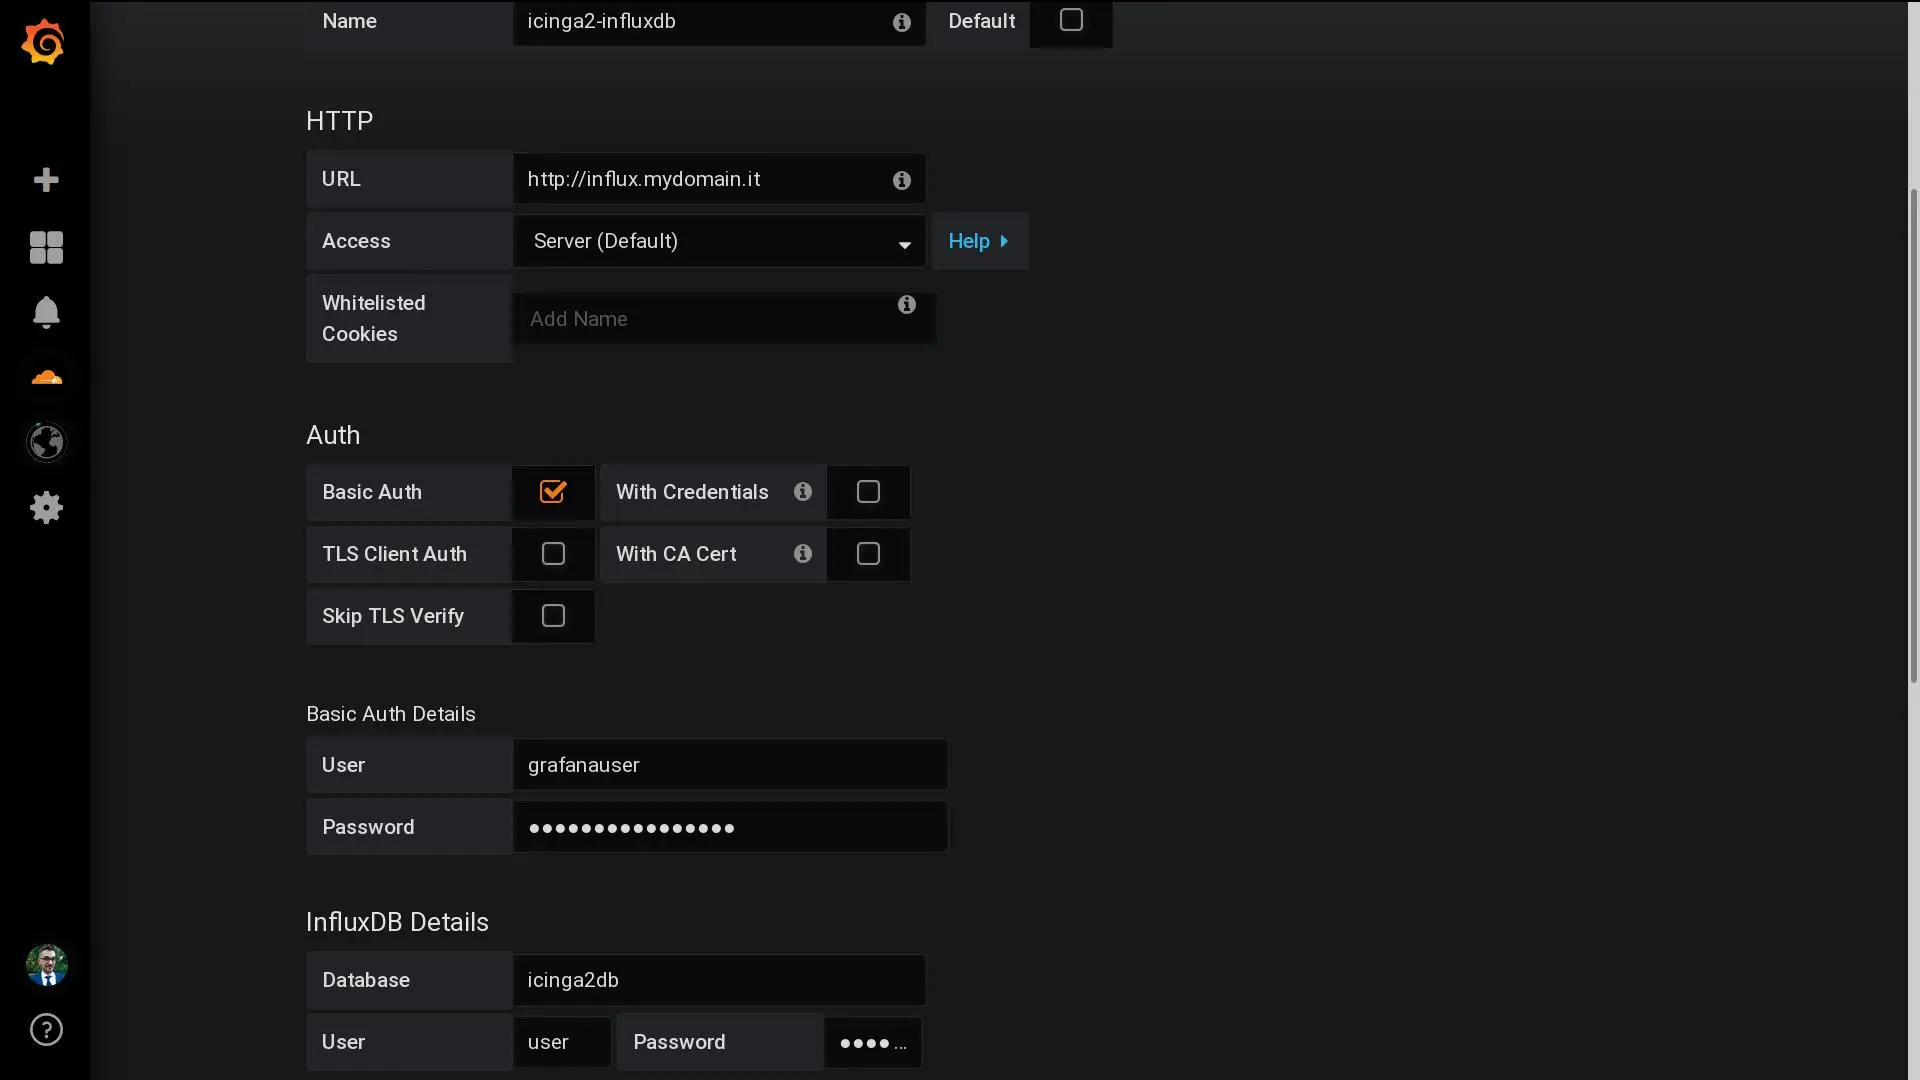
Various dashboards are also available that are already pre-configured for data visualization
You can edit them or create new ones, using the database syntax to work on metrics
Want to talk to an expert?
Contact our Network Monitor consultancy now. Free 30 minutes of analysis!