
Nagios Configuration Guide with Nconf
Nagios
Nagios is one of the most famous monitoring systems (NMS or network monitoring system), it was born in 1999 and has open source license.
Command line configuration makes integration quite complex, that is why many web interfaces have been devised for configuration.
First of all Nconf, which allows defining most of the checks normally needed.
Directory structure
Nagios configuration in "Debian like" systems is placed in /etc/nagios3 or /etc/nagios4.
In this example we will use for convenience Nagios3, the configurations are however compatible with the higher version.
In the /etc/nagios3/conf.d/ we can find the example hosts.
Nagios's own monitoring plugin configurations in /etc/nagios-plugins/config.
All this is defined in the main file: /etc/nagios3/nagios.cfg.
Nagios loads definitions into the directories recursively of hosts, commands, timeperiod etc. present.
Available Features
Part of the features available in Nagios Core include:
- Monitoring of network services (SMTP, POP3, HTTP, NNTP, PING, etc.)
- Monitoring of host resources (load, CPU usage, disk usage, etc.)
- Monitoring Plugin
- Ability to define a hierarchy of using parents
- Notifications
- Optional web interface to see statuses and problems
Nconf
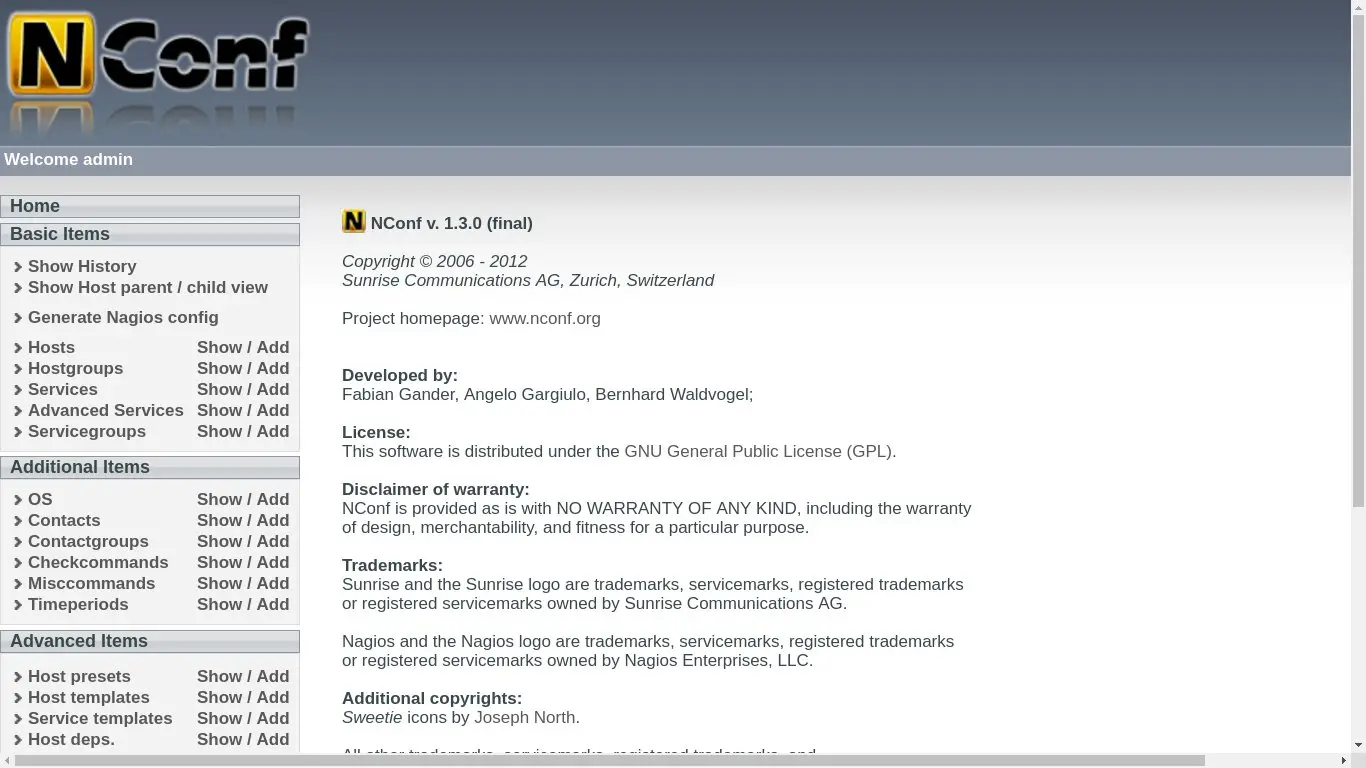
Nconf is a dedicated web interface for creating Nagios configurations.
Through Nconf we can define hosts, services, groups, notification periods, users, checks, and templates, test for configuration errors, and deploy the configuration to a Nagios server securely and without the need to restart the service.
It is also possible to view a history of changes made.
Through the use and application of templates and host groups it is possible to automatically apply all template properties to all members of the group.
Adding a host
Through Nconf we can view present hosts and add new ones. For example, let's try adding google.com with address 8.8.8.8.
We click Host add, define the hostname (in this case google.com), the address (8.8.8.8), we use the host preset generic-switch and the max check attempts that defines how many checks to make before changing the host state.
At this point we can do the submit of the host.
We will be asked whether to add connected services that we will not use for now.
The host is ready and needs to be loaded into the Nagios configuration.
Deploy
It takes care of verifying the configuration and doing the reload into our Nagios server.
First we generate the configuration via the appropriate link on the main bar.
On the page that opens we will see a box in which there is a syntax check that reports any errors and warnings.
Having checked these errors and warnings, we can operationalize the configuration and view the hosts and services on our monitoring server.
Template Application Priority
The following sequence illustrates the order of precedence of attributes applied to hosts (the same order applies to services):
- Highest priority is in attributes defined in the host or service directly
- Attributes defined in template:
- Directly linked to a host or service
- Linked to a service via the
checkcommand - Linked to a host or service via the
notification_period - Linked to a host or service via the
check_period - Linked to a host or service via a collector/monitor, (in distributed monitoring situations)
Templates
Through templates we can define "standards" to be applied to hosts with similar characteristics such as linux-server, which applies a check interval every 5 minutes, notification during workhours and check-host-alive.
Checkcommands
In this section we find the monitoring plugins, which will take care of physically performing the test on the host specified in the configuration.
There are some already specified, in this case 19, and it is possible to define others via the interface.
In Debian and Ubuntu they are located in: /usr/lib/nagios/plugins.
The plugins used are retrieved from this folder by the Nagios settings.
Services
The services allow us to define the type of check to be used, give it a name, define the interval between tests and the check parameters. This will then be applied to a host to be monitored.
Servicegroups
These are logical units into which to subdivide hosts, e.g. web-services all those hosts that have a check_http.
Contacts and Contactgroups
In this section we can define contacts and contact groups to be notified of service and host failures.
Parents
To avoid duplicate or multiple notifications, it is possible to define parents (parents) so that only the top node is notified in case it prevents reaching the underlying one in a tree structure.
Looking for an expert partner?
Visit our dedicated monitoring page and make a no-obligation appointment, a expert network monitor consultant can help you, Free 30' hour!