Tomcat High Reliability Google Cloud
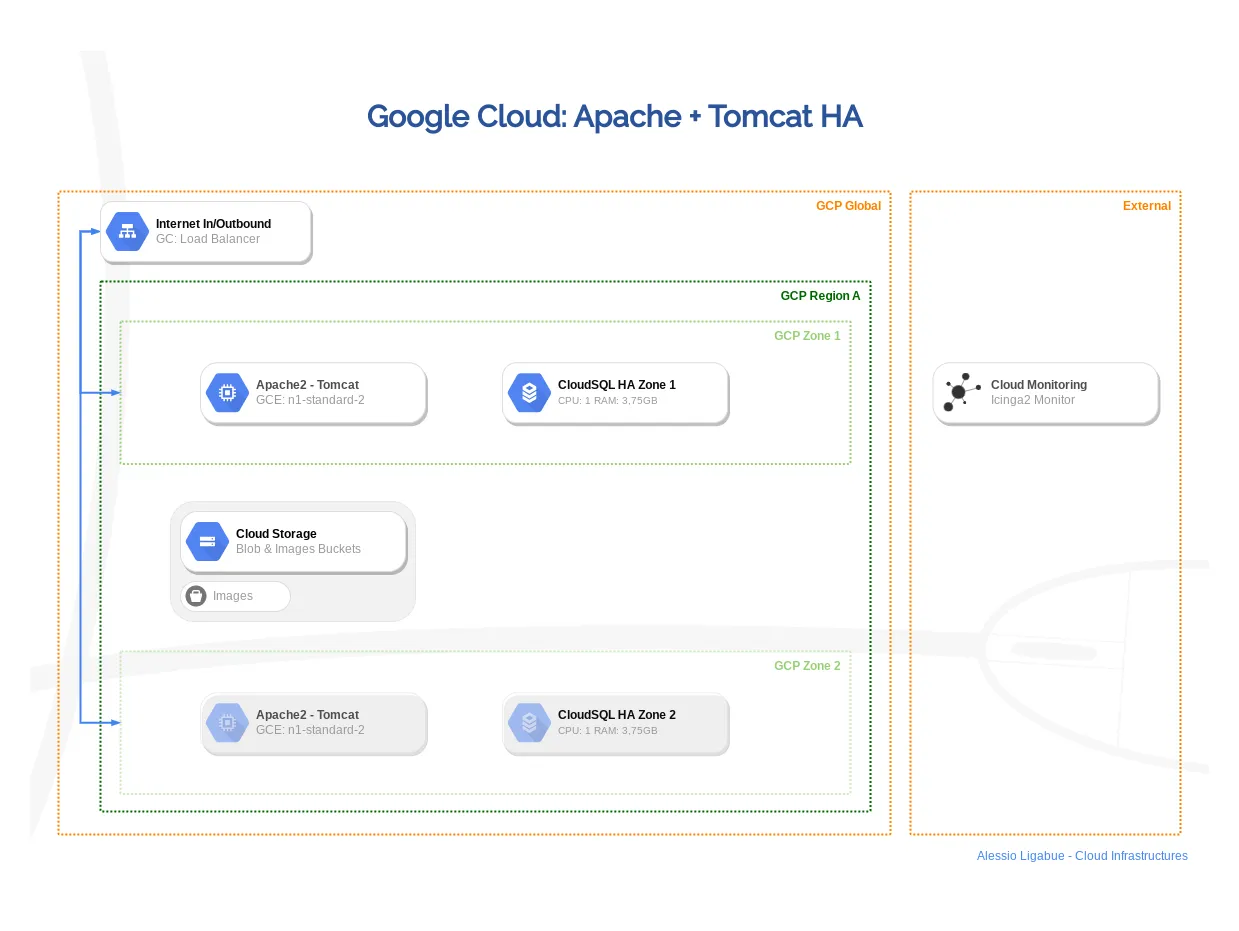
The cloud architecture depicted in the image is a high-availability (HA) solution on Google Cloud Platform (GCP) for an application based on Apache and Tomcat, designed to provide scalability, redundancy, and external monitoring. Here is a detailed description:
Business Requirements
- Zero downtime during upgrades
- Automatic scalability up to 10.000 requests/sec
- Failure detection in less than 5 seconds
- Cloud infrastructure-independent monitoring
Architecture Description
Main Components
- Global Load Balancer (Internet In/Outbound):
- Custom health checks on port 8080 with path /status
- Scaling Policy based on:
- CPU utilization > 70% for 3 minutes
- Average latency > 200ms
- Zone 1 and Zone 2 (GCP Region A):
- Apache2-Tomcat (GCE n1-standard-2):
Two instances of Apache HTTP Server with Tomcat running on GCE virtual machines (n1-standard-2, 2 vCPUs and 7.5 GB RAM). Each zone hosts one instance for redundancy. - Cloud SQL HA (High Availability):
Two managed relational database (PostgreSQL) instances configured for HA. Each instance has 1 vCPU and 3.75 GB of RAM, distributed in separate zones to prevent regional outages.
- Apache2-Tomcat (GCE n1-standard-2):
- Cloud Storage (Blob & Images Buckets):
- Archiving static objects (e.g., images or media files) accessible from Apache-Tomcat instances. It reduces latency and improves scalability.
- Icinga2 Monitoring Server:
- Installed on dedicated VM (e2-micro)
- Checks the status of Tomcat via
check_tcpandcheck_http - Sends alerts on Slack/PagerDuty in case of anomalies
- GCP Load Balancer with Autoscaling
Failover Mechanism
In case of failure of a Tomcat node:
- Icinga2 detects the failure via
check_tcp(timeout 5s) - The GCP Load Balancer automatically excludes the failed node
- The autoscaler starts a new instance in an operational zone
- Icinga2 verifies the recovery and notifies the team
Functioning:
- Inbound traffic:
The global load balancer routes requests to Apache-Tomcat instances in the two zones. If one zone becomes unavailable, traffic is automatically redirected to the other. - Database HA:
Cloud SQL instances are configured for synchronous replication between zones. In the event of a zone failure, the secondary database takes over the primary role without interruption. - Static Content Delivery:
Apache-Tomcat retrieves static files from Cloud Storage, optimizing performance and reducing the load on VMs. - Monitoring:
Icinga2 monitors metrics such as response time, resource utilization, and service integrity, providing visibility external to the infrastructure.
Benefits:
- High Availability:Zone-level redundancy for applications and databases.
- Scalability: Ability to add instances of Apache-Tomcat or Cloud SQL based on load.
- Security: Isolation of critical resources (database and applications) into separate zones.
- Extensive Monitoring: Integration with external tools for complete supervision.
- Response times improved by 40% due to intelligent balancing
- Fault detection external to the cloud provider (+ reliability)
- Cost reduction by 25% with granular scaling
Technical Details
Icinga2 Configuration
# /etc/icinga2/conf.d/tomcat-checks.conf
object Host "tomcat-node-1" {
  address = "10.128.0.2"
  check_command = "hostalive"
}
object Service "tomcat-status" {
  host_name = "tomcat-node-1"
  check_command = "http"
  vars.http_uri = "/status"
  vars.http_port = 8080
}
Autoscaling Policy GCP
gcloud compute instance-groups managed set-autoscaling \
    tomcat-groups \
    --max-num-replicas 10 \
    --min-num-replicas 2 \
    --scale-based-on-cpu \
    --target-cpu-utilization 0.7 \
    --cooldown-period 120
Surpassed Challenges
- Conflicts between health checks: Resolved by synchronizing Icinga and GCP timeouts (5s vs 3s)
- False positives in monitoring: Implemented multiple checks (TCP + HTTP) in Icinga
Frequent Questions
Why use Icinga in addition to GCP tools?
To have an independent monitoring layer that also verifies the proper configuration of the GCP services themselves.
How do Icinga alerts integrate with SLOs?
Through custom plugins that send metrics to Cloud Monitoring to calculate service goals.
What metrics to monitor?
- Thread pool utilization of Tomcat
- Average request processing time
- Number of active sessions
Conclusion
This architecture demonstrates how to combine cloud and open source tools to achieve a resilient system. For a free analysis and evaluation of your architecture visit our Cloud and Open source consulting