


High experience in Open Source solutions and very high professionalism, more than recommended.
Piergiorgio Venuti
CEO & Owner
This was a lengthy and involved upgrade of our Icinga2 environment. Alessio was excellent to work with, and patient with our schedule to get the project complete. I wouldn't hesitate to use him again!
Michael J. Levesque
CEO

Excellent Linux world skills, timelines met..
Luca Bargiacchi
CEO & Owner

I worked closely with Alessio and his company, for a Linux project, networks and firewalls. My company and I are really satisfied, both for professionalism and for convenience. Personally, I was very happy for the punctuality that I consider important to have a serious working relationship. I recommend it to everyone
Mirko Neri
CEO
Alessio is a person with great skills and experience of modern cloud architecture. He thinks on the cutting edge of system administration and services integration. Excellent and result driven. Works towards maximal customer satisfaction. He is ready to deal with difficult situations and solve the problems on time.
Fabio Ferrari
Google Cloud Architect & DevOps Engineer
The best you can find around, few people in Italy know Linux well and he is one of them!
Mohammed El Hassini
Senior Technical Support Engineer

A competent and engaging trainer with the right mix of innovation and pragmatism.
Martina Cavallari
Psychotherapist

Alessio is not just an administrator. He is one of the most experienced Unix Linux guru who I have met during my whole life. He could answer with an open source's solution, to any kind of question.
Nicolò Cati
IT & Data Specialist
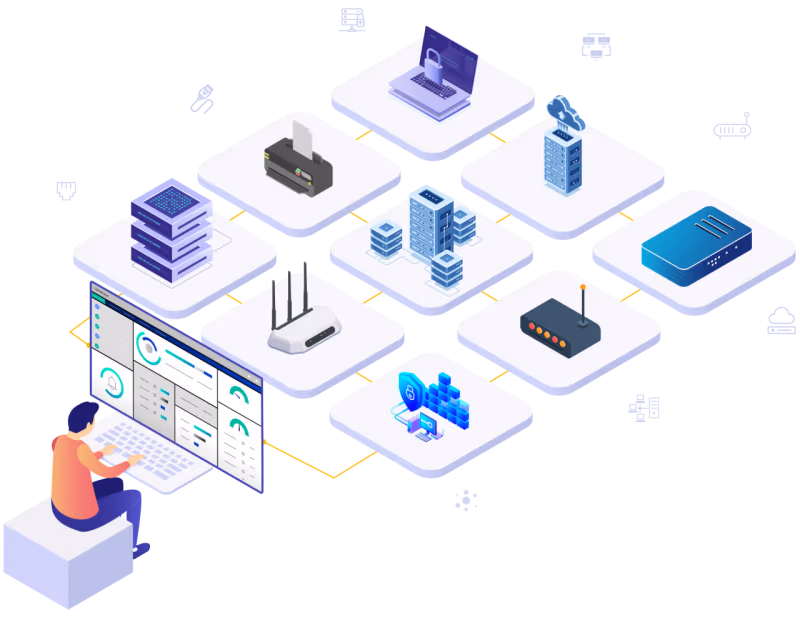
Icinga2 is a monitoring system that monitors the reachability of your network resources, notifies you of disruptions, and generates performance data that can be used for reports It is often paired with Grafana for generating historical graphs to analyze trends over time The modular, open source structure allows for infinite flexibility and integrations, both for device and service plugins and notification channels
Icinga is open-source software, so its use is free. However, costs may vary depending on your configuration, customization, and support needs. If you need assistance with implementation, integration, or advanced management, we can offer tailored consulting to optimize your monitoring system.
Icinga started as a fork of Nagios, but over time it has evolved with significant improvements. Among the main differences:
Improved architecture: Icinga 2 offers more flexibility and performance than Nagios
Enhanced Dashboard: Icinga Web 2 provides a modern and intuitive interface for monitoring management.
REST API support: Icinga includes a REST API for easy integration with other tools.
More dynamic configuration: Icinga uses a more advanced and modular configuration language.
If you want to migrate from Nagios to Icinga or need help choosing the best solution, we can help you with dedicated consulting.
Icinga2 is designed with a distributed architecture, which allows you to easily scale the system by adding new monitoring nodes. It also implements redundancy and high availability from the first releases These features are particularly useful in large or distributed environments.
Icinga2 provides a native API that simplifies integration with other management tools and systems. This API provides greater flexibility and ease of automation than the options available in Nagios.
Icinga Web 2 is the official web interface for Icinga2 and is considered more modern and user-friendly than the classic Nagios interface. It provides greater ease of use and a better user experience. Icinga2 Director makes it easy to create all configurations of hosts, services, checks, plugins, notifications, and to import from external sources, such as VMWare or Active Directory